SOURCE-CHECKED · EVERYDAY TECH
Chrome Task Manager: find the tab slowing your browser
Find a busy Chrome tab, read CPU and memory separately, and try a bounded memory lab before deciding which process to stop.
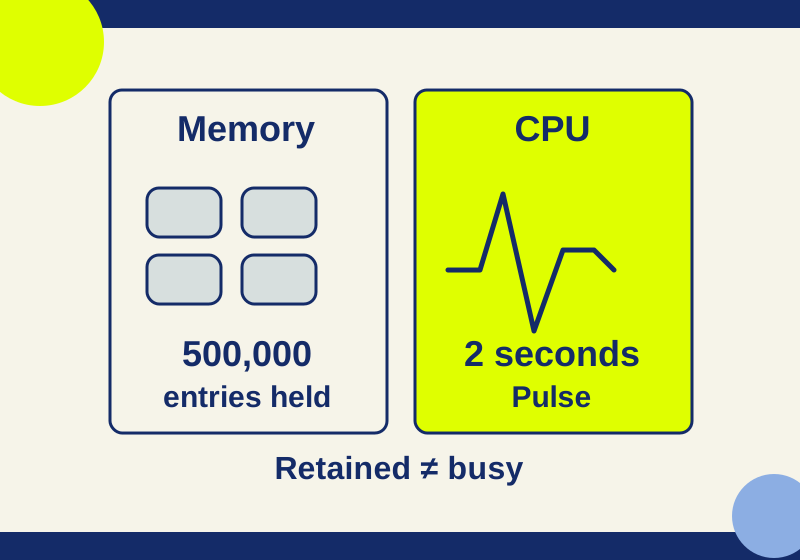
Open Chrome Task Manager with Shift+Esc or More tools > Task Manager. Find the row for the page you suspect, then watch its activity while the problem happens. CPU activity and retained memory answer different questions. The biggest memory reading alone won’t tell you which task to stop.
If you identify a tab you no longer need, close it normally. End Process is available for an unwanted task, but it discards that task’s unsaved work.
Find the row you recognize
Keep the troublesome page open and note its tab title. In Task Manager, look for that title, then select the relevant row. When investigating memory use, click the Memory column heading to bring large readings together. Google’s task instructions describe this sorting and the End Process control.
Several rows can be legitimate. Chrome has a main browser process, content renderers and other processes such as GPU and utility processes. A renderer can host more than one frame. These are different roles in Chromium’s architecture, so a list of chrome.exe processes is not a tab list.
For an ordinary unwanted page, start with its tab. Leave an unfamiliar browser, GPU or utility row alone while you identify what it does. The browser process controls the application; terminating it is a much broader action than closing one page.
If you are comparing Chrome’s rows with an operating-system process list, right-click the Task Manager header and enable Process ID. Chromium’s debugging guide documents this column. The ID matches a process; the page title helps identify the work inside it. Record both when reporting a repeatable problem. A title alone is ambiguous when you have duplicate tabs, and a process ID should be read again after the page reloads.
Decide what the number measures
Watch CPU during the freeze or other unwanted activity. For memory, identify the row behind a large reading and consider whether the page is still needed. These are separate observations: a page can hold data while its active work has stopped.
Chrome’s Memory footprint describes operating-system memory. To see JavaScript memory, right-click a column header and enable that column. Its parenthesized live value represents reachable JavaScript objects. A JavaScript heap value and a process footprint measure different things; do not add them together or treat one as a replacement for the other.
Chrome’s memory guide gives no universal threshold for “too much” memory. The same workload can be acceptable on one device and troublesome on another. It also explains that the browser controls garbage collection. Dropping data that a page no longer needs does not require an immediate fall in the reading.
Try a tab with a known workload
Open the original task lab in a spare tab. Its title is HowCurio task lab: memory and CPU, so you can identify it without using one of your work pages. You can save the HTML and open it locally. It has no external resources, analytics, network calls or storage writes.
The lab has a bounded array allocation and a separate CPU pulse. Nothing starts on page load. Its state box reports how many array entries the page still holds and whether the pulse is running.
- Find the lab’s title in Chrome Task Manager and note the initial reading.
- Click Hold 500,000 array entries. Read the state box: the array is held even while the CPU pulse says stopped.
- Click Run a 2-second CPU pulse if your device is comfortable running a brief workload. It deliberately keeps the tab busy and stops itself. Observe during the pulse; a later reading describes the period after that work has ended.
- Click Release the array. The state changes to zero held entries. Watch what the memory reading does next without expecting an exact return to the starting number.
Hold replaces the lab’s single retained array; repeated clicks do not keep appending arrays. The button label describes a number of entries, not a promised allocation in megabytes. Browser overhead and representation affect the actual memory reading.
In a Chrome 154.0.8037.93 trial on October 7, 2026, the lab produced the following JavaScript heap measurements:
| State | JavaScript heap used |
|---|---|
| Initial, after explicit garbage collection | 0.65 MiB |
| Holding 500,000 entries, pulse stopped | 5.20 MiB |
| After the bounded CPU pulse | 6.12 MiB |
| Array released, before explicit garbage collection | 6.24 MiB |
| Array released, after explicit garbage collection | 1.48 MiB |
The pulse added about 2.001 seconds of recorded script execution. That is execution time, not a CPU percentage. Releasing the array changed the page’s state to zero entries while the measured heap remained above its earlier reading. After explicit garbage collection, the heap fell, but it still did not equal the initial measurement.
This was a clean, headless Chrome trial using DevTools Protocol metrics. The figures measure JavaScript heap use, not native Task Manager readings or total process memory. No Task Manager End Process action was tested. The raw observation CSV contains the byte values; one MiB is 1,048,576 bytes.
Use the lab to distinguish a retained object from current work. It cannot establish that an unrelated website has a memory leak, predict how much RAM closing your tab will recover, or reproduce your computer’s whole-browser performance.
End only the task you intend to discard
Save needed work first. Select the identified unwanted row and click End Process. Google’s instructions state that unsaved work in that task is lost.
The lab also has a disposable text field. In the trial, entering a note and reloading the page left the field empty. That was a reload observation, not evidence about every form’s recovery behavior. Do not try this with an unfinished application, email or payment form.
If identical titles make the row unclear, return to your tabs and close the known unused page directly. When a slowdown returns, inspect the activity while it is happening again. Keep the page title, process ID and the action that triggered the problem together; a single old memory number is a poor description of a recurring freeze.
KEEP GOING
More to explore.
TESTEDEveryday tech
Chrome popup blocker: open the window you need without allowing every site
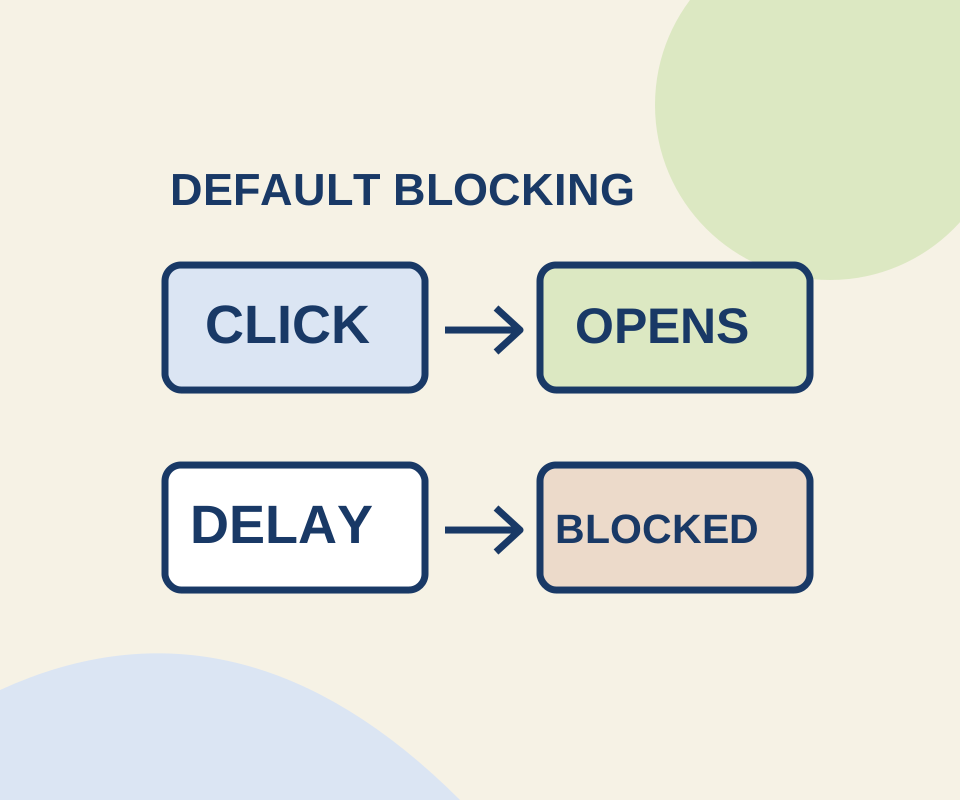
A direct click and a delayed request behaved differently in a controlled Chrome check. Use a site exception for the window you meant to open.
SOURCE-CHECKEDEveryday tech
Chrome Tab Groups on Android: close, find, or delete a group
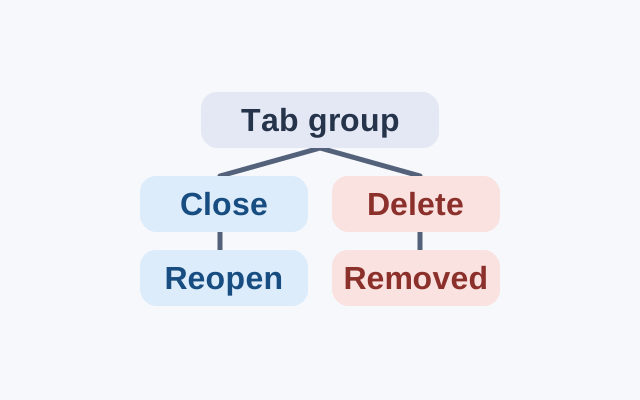
Chrome saves tab group changes automatically. A closed group can be reopened; deleting a group removes it from devices using the same Google Account.