TESTED · FREE DIGITAL LIFE
Google Ngram Viewer: compare word history without misreading the chart
Compare words in Google Ngram Viewer, read its percentage axis, and use a worked denominator example and research worksheet to avoid false conclusions.
Start with this radio and television comparison in Google Ngram Viewer. The October 5, 2026 check displayed both curves: blue for radio, red for television, with English selected, years 1800 to 2022, and smoothing 3. It is a starting point for investigating words in books.
The example below explains how a percentage can fall even when the number of occurrences rises. A downloadable CSV and a research worksheet let you work through the arithmetic and keep a comparison you can revisit.
The controls and the measurement
Google’s Ngram guide explains these settings: a one-word term’s percentage uses all one-word terms in the chosen book corpus and year as its denominator. Smoothing 3 averages a year with up to three neighboring years on each side; 0 is unsmoothed. Searches are case-sensitive; Case-Insensitive includes common capitalization variants. Below the chart, Google Books searches provide context from a broader collection, without identifying the exact books behind a chart point. Ngrams must occur in at least 40 books to be included. Heavy load can cause a flatline; scanning errors and corpus changes also affect results.
In the recorded check, entering radio,television in the Viewer and selecting Search produced the linked chart. For another question, keep a note of the exact query and settings you use.
A falling percentage can accompany a rising count
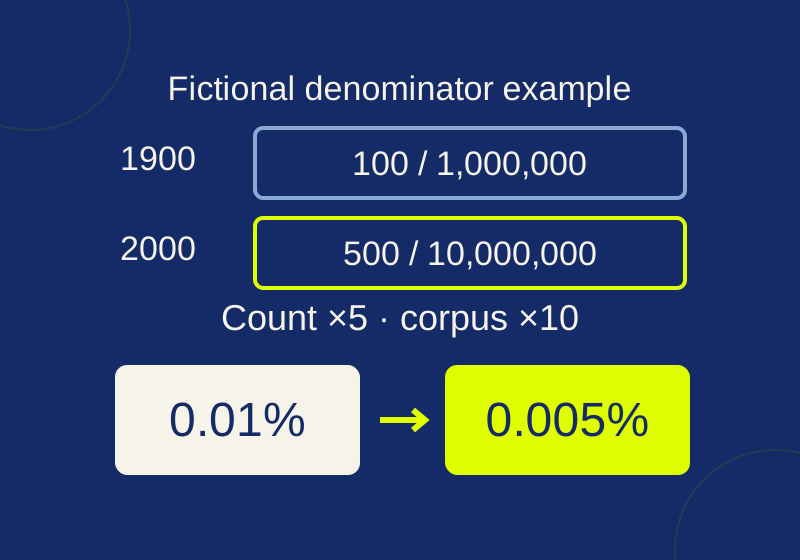
These are fictional teaching numbers from the example CSV. They are not measured Google results.
| Fictional year | Target-word occurrences | All one-word occurrences | Share |
|---|---|---|---|
| 1900 | 100 | 1,000,000 | 0.01% |
| 2000 | 500 | 10,000,000 | 0.005% |
For the first row, divide 100 by 1,000,000, then multiply by 100 to express the result as a percentage:
100 ÷ 1,000,000 = 0.0001
0.0001 × 100 = 0.01%
For the second row, use its own denominator:
500 ÷ 10,000,000 = 0.00005
0.00005 × 100 = 0.005%
The target count increased fivefold. The total count increased tenfold. Because the total grew faster, the target’s share fell by half. Describing only the downward percentage would miss that difference.
A 0.01% share in the first fictional row means 100 occurrences per million one-word occurrences. It is a count of occurrences, so one long book repeating a term could contribute many of them. It does not represent 100 books or 100 readers. You also cannot use these invented denominators to recover the counts behind the actual radio and television chart.
If you put the CSV in a spreadsheet, the calculation for a row is =100*C2/D2 when column C contains the target count and D contains the total. That formula returns a number already expressed in percent units: 0.01 for the first row. Applying a spreadsheet’s percentage display to that result would multiply its displayed value by 100 again. Alternatively, calculate =C2/D2 and apply percentage formatting. Both approaches should display 0.01% when used consistently. The CSV supplies the percentage as a number, with the column named percentage.
Ask a question the words can answer
For the radio and television example, a useful question is how references to those words compare. Device ownership is a separate subject that needs household or sales evidence. Decide which question you are asking before choosing a caption.
For another exercise, try the proposed query bike,bicycle. You might want to investigate whether authors preferred one name for the same object. Before drawing that conclusion, inspect the words in passages: bike could be a verb, while an author might use bicycle in a technical description. This is a suggested investigation, not a claim that those patterns were found in a new chart check.
Likewise, book can name a publication or mean reserving something. A useful note identifies the sense you were looking for. If a passage uses a different sense, record it as a reason to narrow your question. A short note about an actual example helps more than an unexplained statement that a result “confirms the trend.”
Keep a note you can reproduce
The blank research worksheet gives you space for the question, exact query, corpus, dataset identifier if used, years, case setting, smoothing, date checked, graph URL, observed pattern and contextual passages. Start the recorded example’s note with:
Question: How do radio and television references compare?
Query: radio,television
Corpus: English
Years: 1800 to 2022
Smoothing: 3
Recorded chart check: October 5, 2026
Add the case setting you see and the full graph URL. Under “Observed pattern,” describe a feature you can point to on your chart. Under “Books opened,” keep the titles or links you inspected and what the relevant passage meant. Leave a field blank if you have not checked it. Copying the example’s date into a new observation would confuse the two visits.
When you investigate another term or change a setting, retain the first note and give the new visit its own date. You can then identify which input changed instead of comparing two screenshots with unexplained differences.
For a caption, fill in this form using your own settings: “Relative frequency of [terms] in the [corpus] book corpus, [years], smoothing [setting].” Add a short description of what you observed separately. A caption for the recorded example can identify the terms, English corpus, 1800 to 2022 and smoothing 3 without adding an unverified peak or an adoption date.
The original October 5 check displayed both radio and television curves. The official guide was reread and the fictional CSV arithmetic verified October 7. Changes to corpus, case and smoothing and a service data export were not tested.
KEEP GOING
More to explore.
TESTEDApps & the web
Google Earth Timelapse: see a place change, then compare two years
A glacier and the water in front of it look different across two years. Pause on the same location to see what changed and keep the comparison precise.
SOURCE-CHECKEDBusiness documents
Check a Google Docs export in Word before sending it for review
Find missing review material with Word controls and a read-only DOCX inventory before reconciling returned edits.